Lists of frequently asked questions
What information is displayed in the Firewall Log?
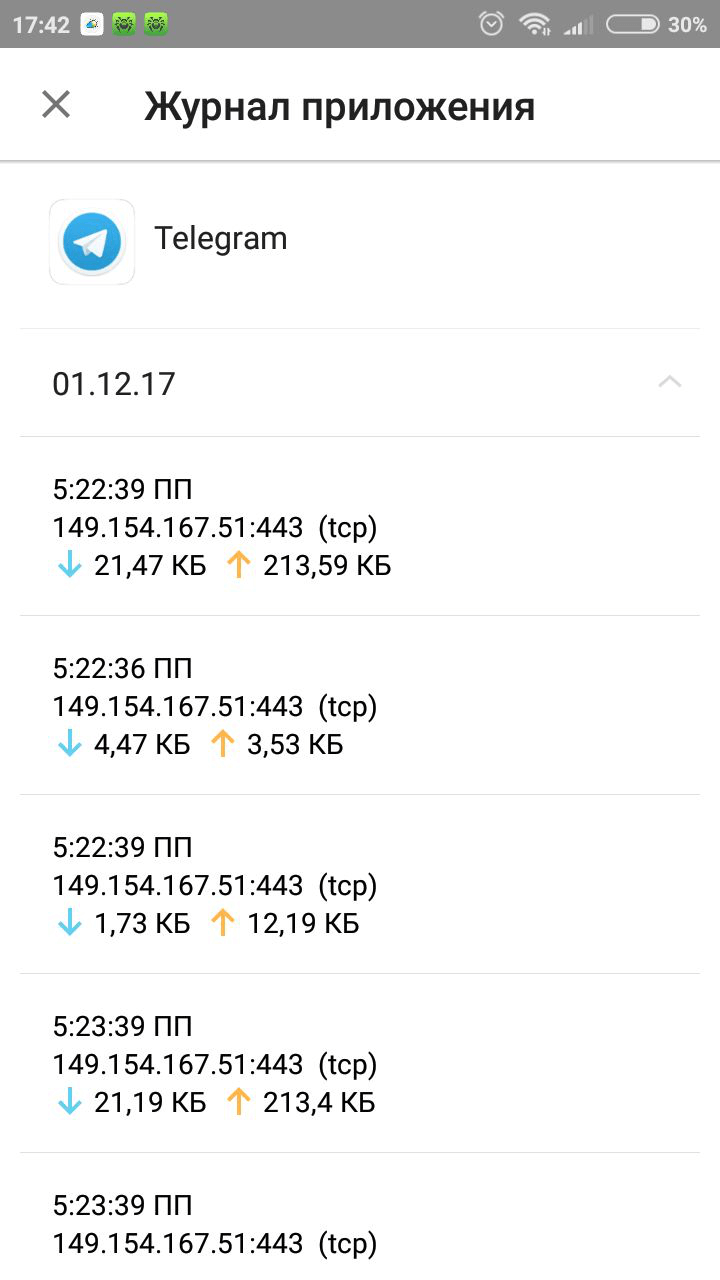
All Firewall actions are logged and recorded in the Firewall Log. The report contains the following information about applications and actions involving them:
- Application name.
- IP address, port, and protocol via which the data was exchanged.
- Date and time of connection (for TCP) or time taken to receive data packets with the corresponding amount of traffic (for UDP). For example: 21/11/2017 22:19:39 — 21/11/2017 22:19:42.
- Local address and local port. For example: src: 192.168.0.102:55512.
- Incoming and outgoing traffic (bytes) or the number of blocked packets. For example: in:124 out:79 or blocked packets:1.
- The identifier of the application on the device associated with this traffic (User ID). For example: uid=10011.
- Number of network congestion incidents (for TCP only). For example: traffic jam=0. Traffic congestion is a special situation when a client program fails to offload a TCP buffer, and that can be the cause of data transfer slowdowns over the network.
To open the Firewall Log, run Dr.Web, open the firewall, and then click on the icon in the form of the vertical ellipsis. Select "Log".

Note that data related to application network activity is stored in a separate Application log that is created separately for each application.
After this, the Firewall starts operating. By default, all network activity is allowed except the use of the Internet in roaming. To manage traffic at your own discretion, you will need to configure the Firewall.
Nothing found